We recently announced an opportunity for fans of A-10 basketball to contribute to A10talk.com this upcoming season. Our man, Igor Jekauc, an engineer by day and a A-10 fan by night, waisted no time in writing this piece on the importance of scheduling in the conference’s mission of establishing itself as a premier hoops conference in D1 NCAA basketball.
Atlantic 10 Strength of Schedule and Earning Conference Respect

It’s that time of year when most college basketball fans are eagerly reading press releases and using detective skills to attempt to piece together their team’s schedules for the upcoming year. Some of us even plan our vacations around sports schedules so the sooner we know them we can start convincing our significant others that it is a good idea to visit some exotic venue for a Thanksgiving tournament. The importance of scheduling and especially out of conference scheduling extends far beyond that. Smart out of conference scheduling is one reason why the Atlantic 10 has been able to get 5+ teams in the NCAA tournament the last few years and has been able to get in the comparison conversation with the ACC and SEC despite having limited Final 4 and National Championship contenders.
One of the heavily criticized but still widely used metrics to compare teams and conferences is RPI. Each numerical measure has its flaws so it is important to understand how they are calculated. A very simple description of RPI formula is given below.
RPI = (WP * 0.25) + (OWP * 0.50) + (OOWP * 0.25)
where WP is Winning Percentage (adjusted for road/home/neutral floor),
OWP is Opponents’ Winning Percentage (unadjusted) and
OOWP is Opponents’ Opponents’ Winning Percentage (unadjusted)
A team’s RPI depends on its own winning record adjusted for home/neutral/away games and its strength of schedule unadjusted for home/neutral/away games (SOS in bold in the formula above). Strength of schedule consists of two terms, heavily weighted opponents’ winning percentage and somewhat less weighted winning percentage of opponents with second degree of separation. Table 1 below lists RPI and SOS values and rank for current A10 teams for the just completed 2013-2014 season from RealTimeRPI.com (http://realtimerpi.com/rpi_Men.html).
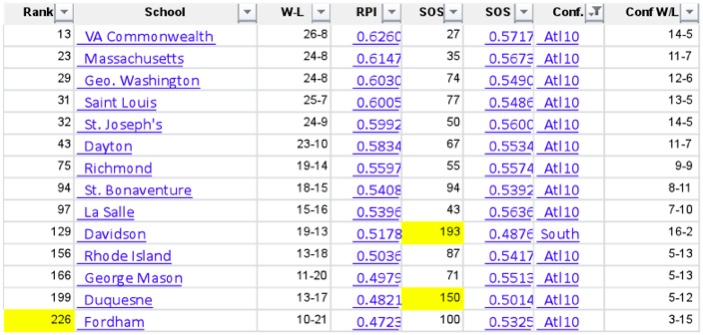
Table 1 – Atlantic 10 RPI and SOS
As you can see, there is a high degree of correlation between a team’s strength of schedule and its RPI in the Atlantic 10. However, there are several examples of teams, like Saint Joseph’s, with very strong SOS rated below teams with slightly lower SOS in terms of RPI. Obviously the difference is due to other team’s better winning percentage (Saint Louis as an example). Davidson is also an interesting example since it had a very decent RPI but awful strength of schedule due to its conference schedule. Needless to say, Davidson’s conference schedule will get quite a bump this upcoming season. Figure 1 shows the RPI vs SOS for all 350+ teams in Division 1 college basketball landscape with Atlantic 10 teams highlighted.
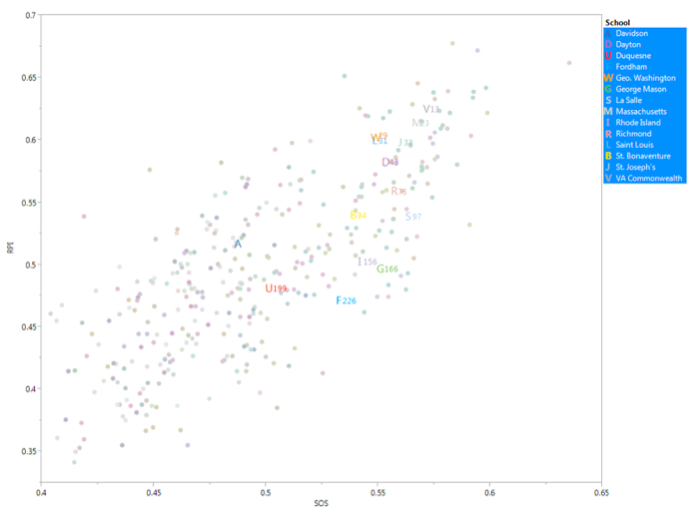
Figure 1 – Correlation between RPI and SOS
Several things are evident from this graph. It’s clear that there is some correlation between RPI and SOS on a team level but that correlation is not overwhelming (R^2 < 0.6). It is also clear that Atlantic 10 as a whole occupies the upper right quadrant of this graph already, which is good (high RPI and high SOS). Davidson and Duquesne are the only weak outliers in terms of strength of schedule with Davidson being handicapped by its conference affiliation in 2013-2014. In terms of RPI; Fordham, Duquesne, George Mason and Rhode Island were outside of the top-150.
Looking at the A-10’s spot in the overall college hoops landscape, let’s examine this data in another way. Graph 2 shows strength of schedule by conference with the Big 12 clearly having the most difficult SOS out of any conference. Other conferences (shown in red: Big 10, Pac 12, Big East, ACC, Atlantic 10, SEC) have schedules that are below the Big 12 but are statistically on par with Big 12. The single high point on the graph is Kansas which had strength of schedule that was a clear outlier to the rest of the nation. No other team came even close to the difficulty of their schedule.
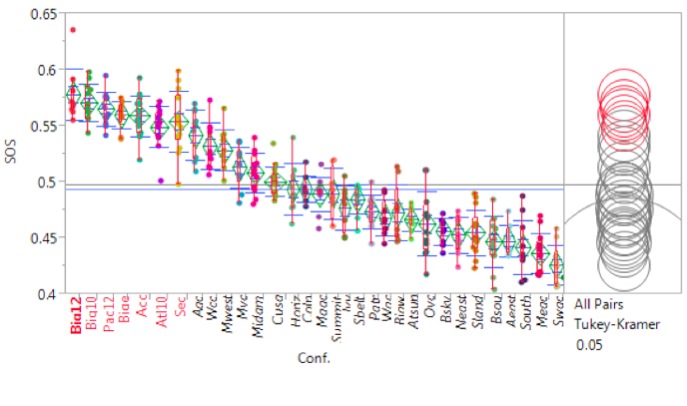
Figure 2 – Strength of Schedule by Conference
Figure 3 shows the RPI values by conference. A couple of things are interesting on this graph compared to the one shown in Figure 2. There is more variability in terms of RPI for individual conferences than for SOS. This is naturally explained by the fact that a large portion of each team’s schedule is comprised of playing other teams in the same conference. It would be unreasonable to expect for one team to have significantly worse SOS than another teams in the same conference. The difference in SOS in each conference is due to teams’ non-conference schedules and unbalanced schedules within a conference. The other interesting thing is that the ranking of conferences in terms of RPI shown in Figure 3 is exactly the same as ranking in terms of SOS shown in Figure 2. Both sets of data also show that Atlantic 10 was very much equal to the ACC in both metrics despite Coach K’s lobbying efforts to prove otherwise.

Figure 3 – RPI by Conference
The fact that RPI and SOS rank conferences in the same order is somewhat curious given the loose correlation between the two shown in Figure 1. That prompted a comparison of average conference RPI versus average conference SOS. That graph is shown in Figure 4 below.
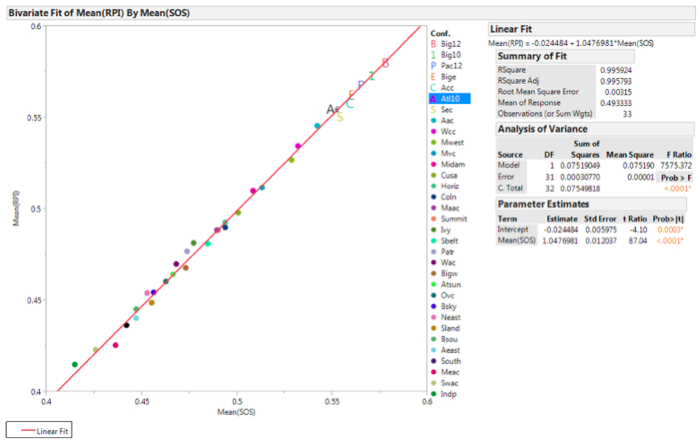
Figure 4 – RPI vs SOS by Conference
The results are very interesting. The graph shows almost a perfect correlation between conference RPI and SOS (R^2 > 0.99). Looking back at RPI formula, this is not an entirely surprising result. SOS is already weighted very heavily (75% of the RPI). Furthermore, since a large number of games each team plays are against teams in the same conference the W/L percentage of each team becomes even less important since the W/L record for all of the in-conference play will end up at 0.500. This further diminishes the role of W/L for each individual team. The fact that in-conference play also results in similar SOS among conference teams as shown in Figure 2 means that majority of opportunity to boost conference RPI comes from non-conference play. That is intuitive and well known. Playing any team out of conference up to the Missouri Valley Conference is probably ok and will not hurt A10 or an individual team. Right around Conference USA/Horizon, teams need to schedule more selectively and need to avoid playing any team below the OVC since none of them had a SOS near 0.5. What is not intuitive is that SOS of any team in the conference is more important than RPI for the benefit of the conference. Looking at A-10 RPI, one would think that bringing up Fordham’s RPI would have improved the Atlantic 10 while really the biggest area of improvement is Duquesne’s scheduling. If Duquesne had scheduled a slightly tougher slate (win or lose), the Atlantic 10 would have finished the year with a higher RPI than the ACC. Obviously Davidson was highlighted as well but their biggest issue was their previous conference affiliation. If Davidson keeps the same non-conference schedule they will improve significantly just from in-conference play rather than being hurt by it. The other thing to help the Atlantic 10 earn more respect would be to have teams regularly make deep NCAA tournament runs. St. Louis had a great opportunity with their experienced teams the last two years. We were all pulling for La Salle in 2013 and Dayton this past season. We just need to cross the Sweet 16/Elite 8 threshold and into the Final 4 and Championship appearances (editors note: easier said than done). Then we will just have to fight the historical bias. Even if we are able to match the ACC/SEC, the Atlantic 10 has a long way to go to build a similar type of history. Let’s hope that some of the top tier teams for the upcoming year can cross this threshold.
4 Comments
RT @sports_fool39: Very informative reading regarding scheduling & RPI. Thanks. “@A10Talk: Earning conference respect through SOS: http://t…
This analysis of the NCAA ranking system really helps me to understand out of confrence games. I had no idea what I was missing. It used to be that when I watched vcu play, I wanted them to win. When vcu would lose I would be sad and depressed. When vcu won I would be filled with glee. I never knew I could appropriate my level of glee or depression based on RPI or SOS.
Igor Jekauc liked this on Facebook.
Good read. A little dense but interesting, esp like last section. “@A10Talk: Earning conference respect through SOS: http://t.co/GCW9ucZYVS”