
We have yet to reach the month of November, but the NCAA decided to release its first NET rankings — the new RPI-esque system that’s meant to be a tool for the Selection Committee. To the surprise of many, Ohio State emerged as No. 1, and Loyola Marymount cracked the top 10; it quickly became evident that the algorithm needs a bit more game data before its reliable for any kind of analysis.
So how did the Atlantic 10 fare in the first NET rankings? Well, the highest ranked team was… Duquesne?!? The Dukes are off to a 4-1 start to the season with wins over Radford and William & Mary; though Kenpom has Duquesne as the 8th best team in the conference and the 152nd in the nation. Here’s how the rest of the league stacked up:
#40 Duquesne
#56 VCU
#62 Saint Louis
#69 Dayton
#100 Davidson
#127 Fordham
#149 Saint Joseph’s
#160 URI
#172 UMass
#257 Mason
#263 Richmond
#275 GW
#322 St. Bonaventure
#336 La Salle
Obviously, it’s hard to draw much of a conclusion from any of this considering most teams have 5 or 6 games of data. The question seems to be: why did the NCAA release this in the first place? The Selection Committee’s process has been a black box forever, and I can understand the public calling for a more transparent system, but early signs point to the NET looking a lot like ESPN’s RPI, which ends up being pretty much useless as a tool for picking the field of 68. Jon Rothstein hits this one on the nose:
NET makes its debut, but remember: Making the NCAA Tournament is still ultimately based on beating teams who are projected to be in the NCAA Tournament. https://t.co/XEHbQk5jtQ
— Jon Rothstein (@JonRothstein) November 26, 2018
Each team will subjectively have its resume evaluated, and when it comes down to it, you gotta beat tournament teams to make the NCAA Tournament. Oh, and you can’t lose to the Stony Brooks of the world. But since this has been such a hot topic of interest, and everyone loves to see where there team ends up in the NET rankings (I’m sure there will be multiple releases throughout the season), I’ll do my best to breakdown why the algorithm seems to have A-10 teams where they are.
The NET takes into account 5 factors in its algorithm. This is what the NCAA gives us. Net efficiency (the 2nd 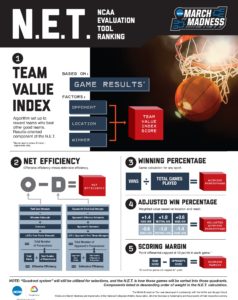 factor considered) is likely to look most like Kenpom’s rankings, though Kenpom factors in preseason ratings that aren’t completely weeded out until mid-January. So a team like George Mason who’s had a tough start to the season but had higher preseason expectations is likely still higher in Kenpom compared to Fordham who has a 5-1 start to the season. In fact, that’s exactly the case, as Fordham still ranks last in Kenpom. The NET however, is unlikely to have any behind-the-scenes preseason considerations, as a team like Loyola Marymount is able to emerge to the top 10 so early. The NET also looks at adjusted win percentage, which I find interesting. A neutral win is given a +1.0 score, a road win is given +1.4, and a home win is given +0.6. A road loss is given -0.6, and so on and so forth. Duquesne boasts a neutral site win over Radford and has its only loss on the road to a strong Notre Dame team. In fact, Duquesne and Fordham are the only 2 teams in the conference who have not lost at home or on a neutral court. Each team’s only loss has come in a true road game. I’m not sure how much the algorithm considers point #4, but it seems pretty influential considering Fordham is 6th in the Atlantic 10 and Duquesne is 1st.
It’s also interesting to me that point differentials are capped at 10 points in each game — that likely hurts a team like Saint Joseph’s. The Hawks’ first 3 wins of the season appear as 10 point victories in terms of scoring margin by NET, but a 7 point loss to West Virginia and a 2 point loss to William & Mary come at face value. That might be a reason it’s not surprising to see them come in at 7th at this point.
We can pick apart the NET rankings and try to guess why teams are where they are right now, but none of this really matters, and I’m a bit skeptical the system will end up being reliable enough to be one of the main considerations for the Selection Committee. I think Kenpom is great for evaluating how well a team is playing at a point in the season (i.e. Davidson ended the season 43rd last year and was playing much better than a 12 seed). But again, neither is likely going to be that useful in evaluating a resume. As much as we’d like it to, I’m doubtful a computer algorithm is going to spit out the perfect field of 68 at the end of the year. Which means what? The Selection Process will remain a black box of subjective decision-making, evaluating resumes for their good wins and bad losses. And honestly, that’s probably how it should be.